The 2021 Google Page Experience Update Explained
Over the last decade, Google has rolled out a number of major updates to its algorithm designed to improve the search engine. They’ve gone after spammy sites, they’ve personalized results, and they’ve incorporated high-tech advances like machine learning, among other tweaks (Moz maintains a history of major algorithm updates).
With the Page Experience update, Google is renewing its focus on the technical aspects of a user’s search experience...also known as user experience, or “page experience,” as Google calls it.
Page experience signals include how quickly the main content loads, how quickly a user can interact with the page (such as click a link, expand a menu navigation, or type in a search bar), and how intrusive any ads may be.
While many of the factors have long been part of Google’s algorithm, the Page Experience update expands the range of signals and seeks to broaden the scope when measuring a user’s experience on a web page.
We want to explain--in layman’s terms--how it may affect page rankings and what you can do to ensure a passing grade and protect your ranking.
Page Experience Update: The Basics
When did it happen? “Mid-June” of 2021, with full completed at the end of August 2021.
Why did it happen? Connecting people with the answers they’re looking for is what Google does. The faster and more safely they can do this, the better, because it’s better for users. So they want to reward pages that load quickly and correctly and demote sites that are laggy and/or deceptive or full of malware.
Why should we care? This update will incorporate additional signals of page experience as a direct ranking factor on both mobile and desktop. In addition, after the rollout, pages that pass the Page Experience test may have a badge displayed in search results certifying it, according to a Google insider. Pages with a “pass” badge are likely to experience a higher click-through rate from search results.
Finally, good website performance is its own reward: bounce rates go up and conversion rates go down proportionally to how slow a site is to respond.
How important are the Page Experience factors compared to other ranking factors? Google has suggested that page experience signals may be used as more of a tie-break between similar competing pages. The most important factor will remain having content that provides a relevant match to the search query, even if the user experience is sub-optimal.
How much have rankings been affected by the update? Not very much according to a study by Sistrix which measured ranking changes in 46,042 websites that were failing in Core Web Vitals a month after the update.
This met our expectations that the impact would be minimal based on how Google intends to use it (more as a tie-breaker), and given that many of the signals have been ranking factors for years, we predict a fairly mild impact.
A “pass” badge in search results - if it is ever introduced - might have a noticeable effect on click-through rates from search results.
How can you know if a site is passing the Page Experience test? You can view the Page Experience report in Google Search Console. You can test a website from the outside at web.dev or PageSpeed Insights but evaluating each page in Search Console is the truer measure.
Digging Deeper: The Page Experience Signals
Google will determine page experience scores based on the following factors, some of which have already been in use and some that are new:
1
Core Web Vitals: This is the big new category that’s grabbing a lot of attention. URLs with status Poor or Need improvement in the Core Web Vitals report are marked as Failing in the Page Experience report. We’ll delve into CWV below.
2
Mobile Usability: The page must be mobile-friendly, meaning users don’t have to pinch their phone screens to zoom to make content readable. URLs with mobile usability issues in Google Search Console’s Mobile Usability report will be marked as Failing in the Page Experience report.
3
HTTPS usage: If the ratio of pages on your site that use HTTP to the number that use HTTPS is “too high,” you’ll see an HTTPS warning in the Page Experience report, as well as a warning banner on your site.
4
No intrusive interstitials: Pages that show an interstitial - think popup ads - that users need to dismiss before accessing the content typically provide a poorer experience, especially on mobile where they often occupy the entire screen. Interstititals can also negatively impact the layout stability of a page, affecting one of the three Core Web Vitals metrics - Cumulative Layout Shift.
Two additional signals were initially part of the Page Experience update, but were dropped by Google during the roll out.
Safe browsing is about providing a secure user experience and refers to hacked sites, deceptive pages, and harmful downloads. However, Google recognized this is often out of the control of webmasters and was confirmed not to be a ranking signal and, as a result, also omitted from the Page Experience report.
Ad Experience (which only affected sites that hosted ads on their own site) was always out of place in that it was never a ranking signal for Page Experience.
Through Google Search Console both safe browsing and ad experience reports will be available to site owners, but they will not be part of the Page Experience report.
What Are Core Web Vitals?

These new signals have to do with a page’s speed, responsiveness, and “visual stability.” The data for each is provided by real users who have opted in to reporting their usage statistics as they browse. These are the three metrics used:
Largest Contentful Paint: LCP is the amount of time it takes to render the largest content element visible in the viewport from when the user requests the URL. Typically this is an image or a video, although it can also be text. Google’s benchmark for a good time is no more than 2.5 seconds. This is basically what we’d consider in the days of newspapers as everything “above the fold.”


First Input Delay: FID is the time between a user first interacting with your page (clicking a link, tapping a button, etc.) and the browser responding to that interaction. This is important on pages where the user needs to do something, because this is when the page has become interactive. Google recommends an FID of less than 100 milliseconds.
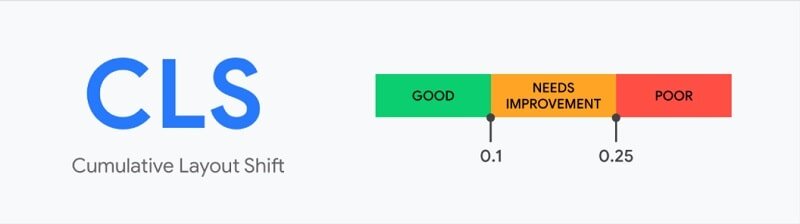
Cumulative Layout Shift: When you attempt to click a button on a web page, but it suddenly moves and you end up clicking an ad, that’s layout shift. It happens because elements loaded at different speeds, and it makes for poor user experience. CLS measures the sum total of these shifts during the page’s lifespan. A score of zero means there’s no shifting, and the more layout shift on the page, the larger the number. Google considers a good CLS to be 0.1 or lower.
If you can't seem to find the reason for a high value, try interacting with the page to see how that affects the score.
How to Improve Your CWVs?
If fewer than 75% of your pageviews result in a “good”-level experience, you’ll need to get your CWVs up. Here’s how:
Use Google Search Console to view your URLs and organize them by (failed) Page Experience signal. Start with "Poor" URLs first.
Run sample URLs for each failing metric through Google’s PageSpeed Insights tool.
Use the "Opportunities" (to improve page load time) and "Diagnostics" (these help a page adhere to best practices, but may not necessarily boost performance) to identify issues with similar groups of URLs.
Take action to improve low metrics. For example, you can use JavaScript to pre-load content and improve LCP. Conversely, reducing the amount of JavaScript on a page may improve FID. See below for more helpful resources.
Test again in PageSpeed insights.
When you’re satisfied, start validating the fixes in Search Console. You can validate fixes for each metric separately.
Monitor Your CWVs with the Core Web Vitals Report
You can use the CWV report in Google Search Console to view your URLs’ performance, broken down by mobile and desktop and Good, Needs Improvement, and Poor scores.

Note that only indexed URLs can appear in this report. If a URL doesn’t have a minimum amount of reporting data for a particular metric, it’s left out of the report. Once a URL hits the threshold data amount for any metric, the page status reflects its most poorly performing metric.
When a group of URLs provide a similar user experience, an issue is assigned to them. Google assumes the pages share the same underlying problem, such as a slow-loading feature used on each.
Resources to Achieve Good Page Experience Signals
Google’s original announcement of the Page Experience update
Article: “Why Does Speed Matter?”
Check Core Web Vitals with Pagespeed Insights
Google’s guide to Fast Load Times
Check if your pages are mobile friendly: Google’s Mobile Friendly Test